
finplot
Finance Plot, or finplot, is a simple and efficient way of backtesting your trading algorithm on stock or cryptocurrencies.
I built finplot to overcome the bad performance and horrific zoom/pan of most other finance plotting libraries. And it's trivial and fun to use!
Let me show you how easy it is. This shows Apple's stock price over the last two years:
import finplot
import yfinance

df = yfinance.download('AAPL', '2018-08-24')
finplot.candlestick_ochl(df[['Open','Close','High','Low']])
finplot.show()
If you want to add a moving average to that, you simply add this line before calling show():
finplot.plot(df.Close.rolling(20).mean())
Even more advanced concepts like the one below can calculated and plotted in less than forty lines of code.
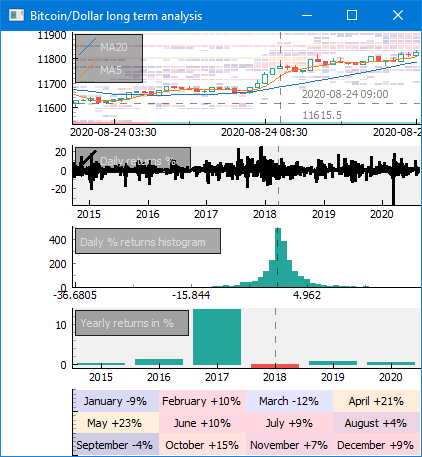
I've included more than half a dozen examples in the source code, including technical indicators such as Heikin Ashi, MACD, volume profile, VWAP and much more. Check it!

